Home >> Information - Time Series
Coursework Notes - Information
introduction |
Time series graphs - this is the collective name for all graphs that have time as the x-axis.
There are 3 types of graph:
|
'Seasonality' & Cyclic time series
Seasonality is the term for data that has a periodicity of one year. That is, it alters over a period of one year, then repeats to some degree. The highs and lows may alter, but the general shape of the graph is similar year on year.
Similarly a Cyclic time series repeats itself. However, this is a more general term. The period may be seconds(like the beat of a heart) or thousands of years(like the coming and going of ice ages).
Trends - the 'Moving Average'
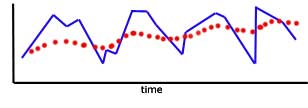
A trend is a simplification of chaotic time-related data to show the underlying movement of values.
A Moving Average is simply the average of consecutive blocks of data. In this way, fluctuations in a curve are 'ironed out'.
The number of pieces of data in a block is termed the number of 'points'.
3 pieces of data in a block is a '3 point' moving average
10 pieces of data in a block is a '10 point' moving average ....etc.
It is important to remember that the starting point of each block advances by one number each time.
Example - calculate four point moving averages for the following results:
1 3 8 4 5 7 3 8 2 13
4 point numbers |
4 point average |
||
1 3 8 4 |
4 |
||
3 8 4 5 |
5 |
||
8 4 5 7 |
6 |
||
4 5 7 3 |
4.75 |
||
5 7 3 8 |
5.75 |
||
7 3 8 2 |
5 |
||
3 8 2 1 |
3.5 |
||
8 2 13 |
3.5 |
||
NB plotting of moving average points - the moving average for each block of data should be plotted in the middle of each number block
That is, the first moving average should be plotted between the 2nd and 3rd. reading along the x-axis.
The second moving average should be plotted between the 5th and 6th reading, and so on.
[ About ] [ FAQ ] [ Links ] [ Terms & Conditions ] [ Privacy ] [ Site Map ] [ Contact ]