Home >> Shape & Space - Sin, Cos, Tan Compared
Coursework Notes - Shape & Space
changing sign +/ - |
Changing sign of ratios with increasing angle
In turn, look at each ratio as the value of x and y changes with increasing angle.
![]()
![]()
![]()
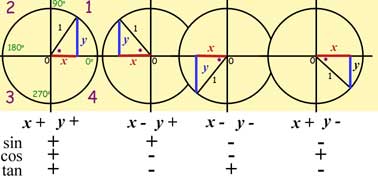
If you are not sure about sign division look back here
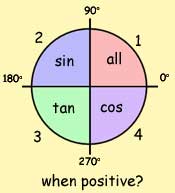
The results can be summarised in this diagram:
The Sine Curve
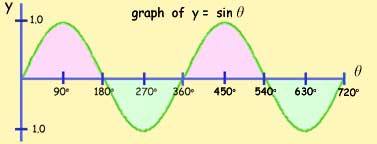
note:
|
The Cosine Curve
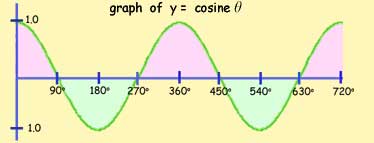
note:
|
The Tangent Curve
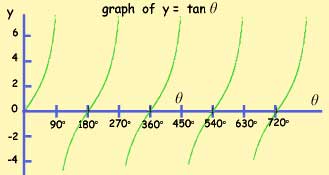
note:
|
[ About ] [ FAQ ] [ Links ] [ Terms & Conditions ] [ Privacy ] [ Site Map ] [ Contact ]