Home >> Information - Representing Data
Coursework Notes - Information
bar/block graph |
Bar/block graph
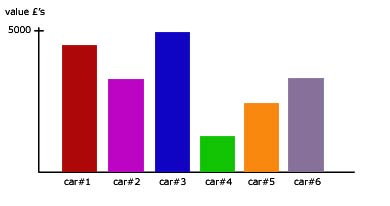
Not to be confused with a histogram, a bar chart/graph has columns of equal width, with height representing some variable, usually a number(eg frequency, % money).
The base of each column can represent anything (eg a car type, a person's name, a company).
Unlike a histogram, in a bar graph the columns need not be adjacent to eachother .
Pie Chart
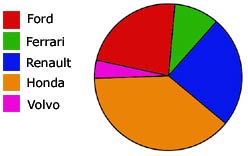
One sweep of the circle 360 degrees, represents the whole.
Percentages are represented by different angles, like slices of a pie/cake.
In our example the angle in degrees for each car make is given by:
'% import' x 360
100
car make |
% imports into country X |
Ford |
20 |
Ferrari |
12 |
Renault |
26 |
Honda |
35 |
Volvo |
7 |
Scatter diagrams/graphs
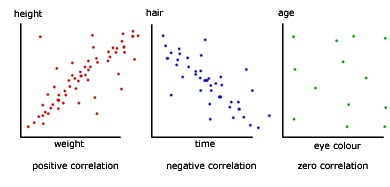
When two sets of data are plotted against eachother, a scatter of points is produced.
Correlation is the relationship between one set of data and the other.
An exact correlation would be '1' (a straight line graph with all the points on the line), while a zero correlation is '0'.
The first graph would have a correlation between 0 and 1.
The second graph would have a correlation between 0 and -1.
The third graph would have a correlation close to zero.
Stem & Leaf table
Stem & leaf tables are similar to bar charts but differ in two distinct ways:
|
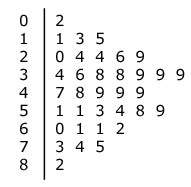
The numbers displayed are:
|
2
11 13 15
20 24 24 26 29
34 36 38 38 39 39 39
47 48 49 49 49
51 51 53 54 58 59
60 61 61 62
73 74 75
82 |
[ About ] [ FAQ ] [ Links ] [ Terms & Conditions ] [ Privacy ] [ Site Map ] [ Contact ]